Since Google switched from a lexical search engine to the semantic web, building topical relevance has become one of the best strategies for ranking.
Topical relevance, also called topical authority, is a semantic SEO methodology for increasing visibility and driving more targeted traffic to your website. It involves proving your expertise on a topic by covering more precise entities, subtopics, and attributes associated with such a topic in Google’s knowledge graph. To do this, you need a plan for producing comprehensive, insightful, and relevant content and structuring it in a way that’s easy for the search engine and users to understand.
In semantic SEO, this plan is derived from a topical map, and here we cover how you can create one for your website in minutes.
What is topical mapping in SEO, and why is it important?
A topical map is a visual representation of your website’s content network. It defines all the concepts you have written about for a given topic and shows their relationship with each other in a logical, contextual manner. You can also build topical maps around concepts, and use them to fill in the gaps in your own content.
The essence of building topical maps in SEO is to achieve topical authority. But apart from that, it’s worth doing for the following reasons:
- A topical map guides you to organize your content for better user experience and engagement.
- It helps the search engine understand the context and relevance of your content. This way, it can associate your website with topically related queries, resulting in higher visibility and ranking.
- A topical map guides your semantic SEO strategy by helping you uncover search queries relevant to your website and industry.
- By defining your content topics and subtopics beforehand, topical maps help prevent content cannibalization.
- A topical map helps you build a strategic internal linking structure that ensures seamless site navigation for users and improves content discoverability by search engine crawlers.
How to create topical maps
To create a topic map, you need to build a topic/sub-topic content hierarchy that emulates how Google looks at and understands topic structures. This involves identifying the main topic(s) for your niche or business and then breaking it into categories with supporting subtopics that serve all possible questions a searcher might have.
To build this content hierarchy, you can use our tool—InLinks content planner—to discover the related entities Google associates with a topic. Note that InLinks creates two types of topical maps –
- site-wide topical map and
- a SERPs topical map.
If your website is live with existing content pages, the website topical map will give you a measure of your site’s authority in your niche by showing you the topics you currently cover and those you do not. Use this insight to audit your website and improve your content efforts.
The SERPs topical map (which we’re focusing on in this article) shows you all the related entities you need to cover to build authority for a given topic. For this, the InLinks natural language processing algorithm looks at SERPs results and features like Knowledge Panels, Auto Suggest, and People Also Ask to analyze your topic and extract entities.
Start with a broad topic
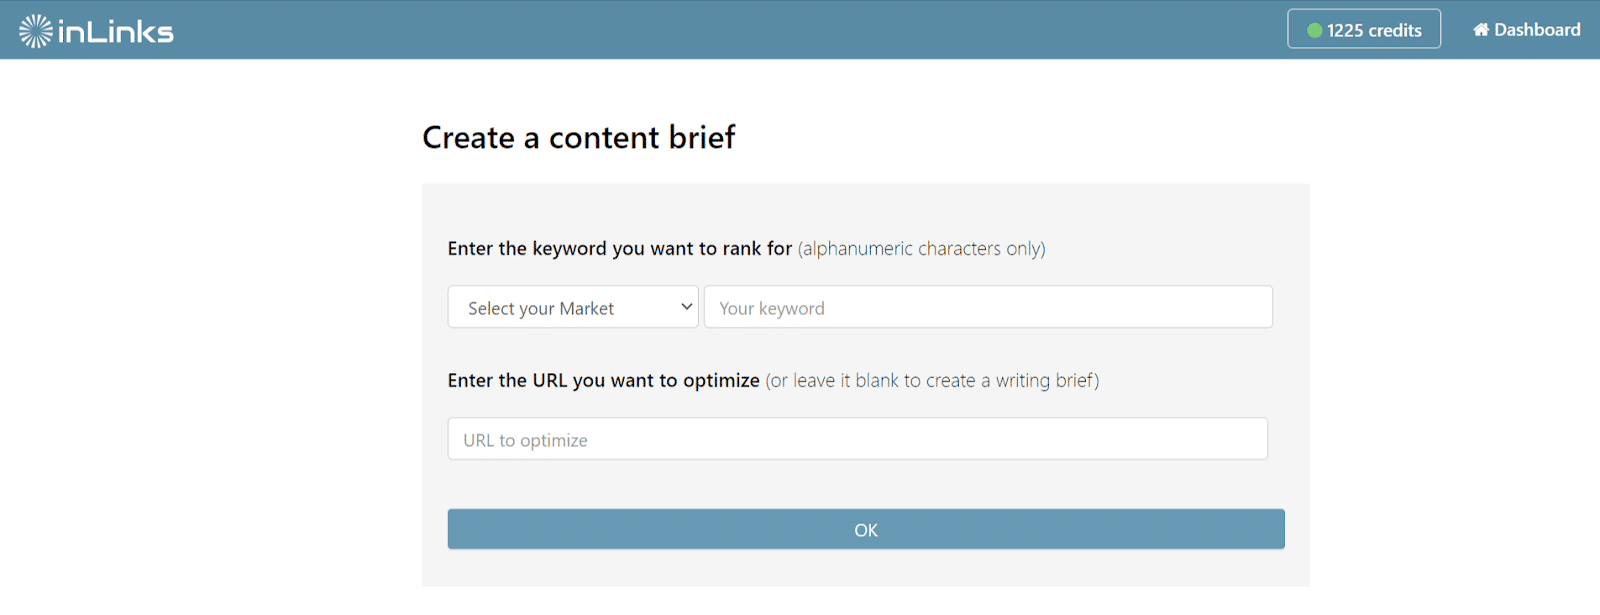
It starts with a broad topic you want to become an authority on. So, go into your InLinks dashboard and run a new content brief for your topic. Select your target market, add the broad topic in the keyword field, and click OK. Our NLP will start its analysis, and you may want to step away for a cup of coffee as it may take several minutes to complete.
Once the analysis is complete, it’ll open your keyword research report. Navigate to SERP Analysis on the left side panel.
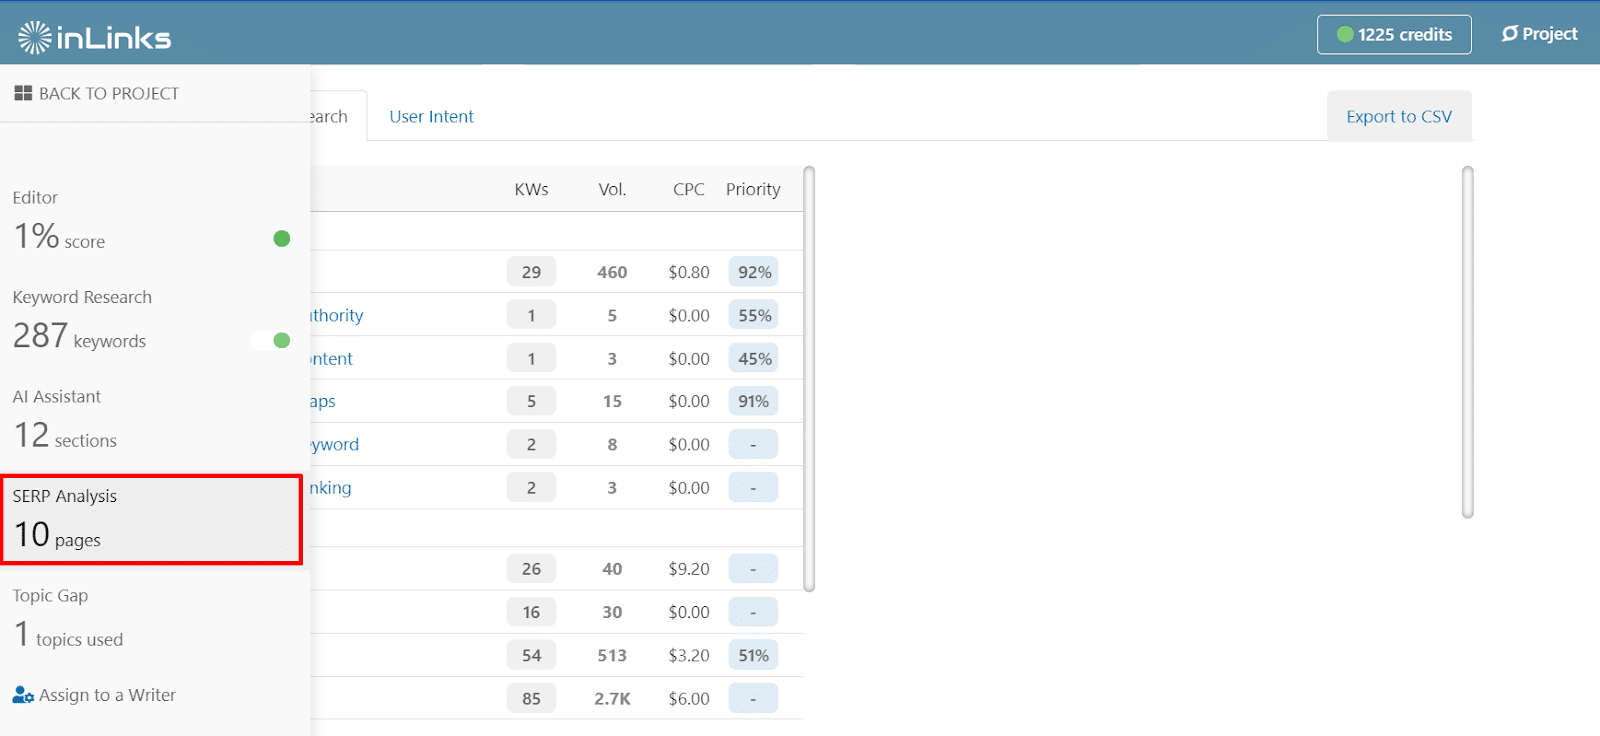
Then click Topic Chart on the next screen to display the topical map for your topic. It’s represented in a topic wheel.
Analyze your topics and subtopics
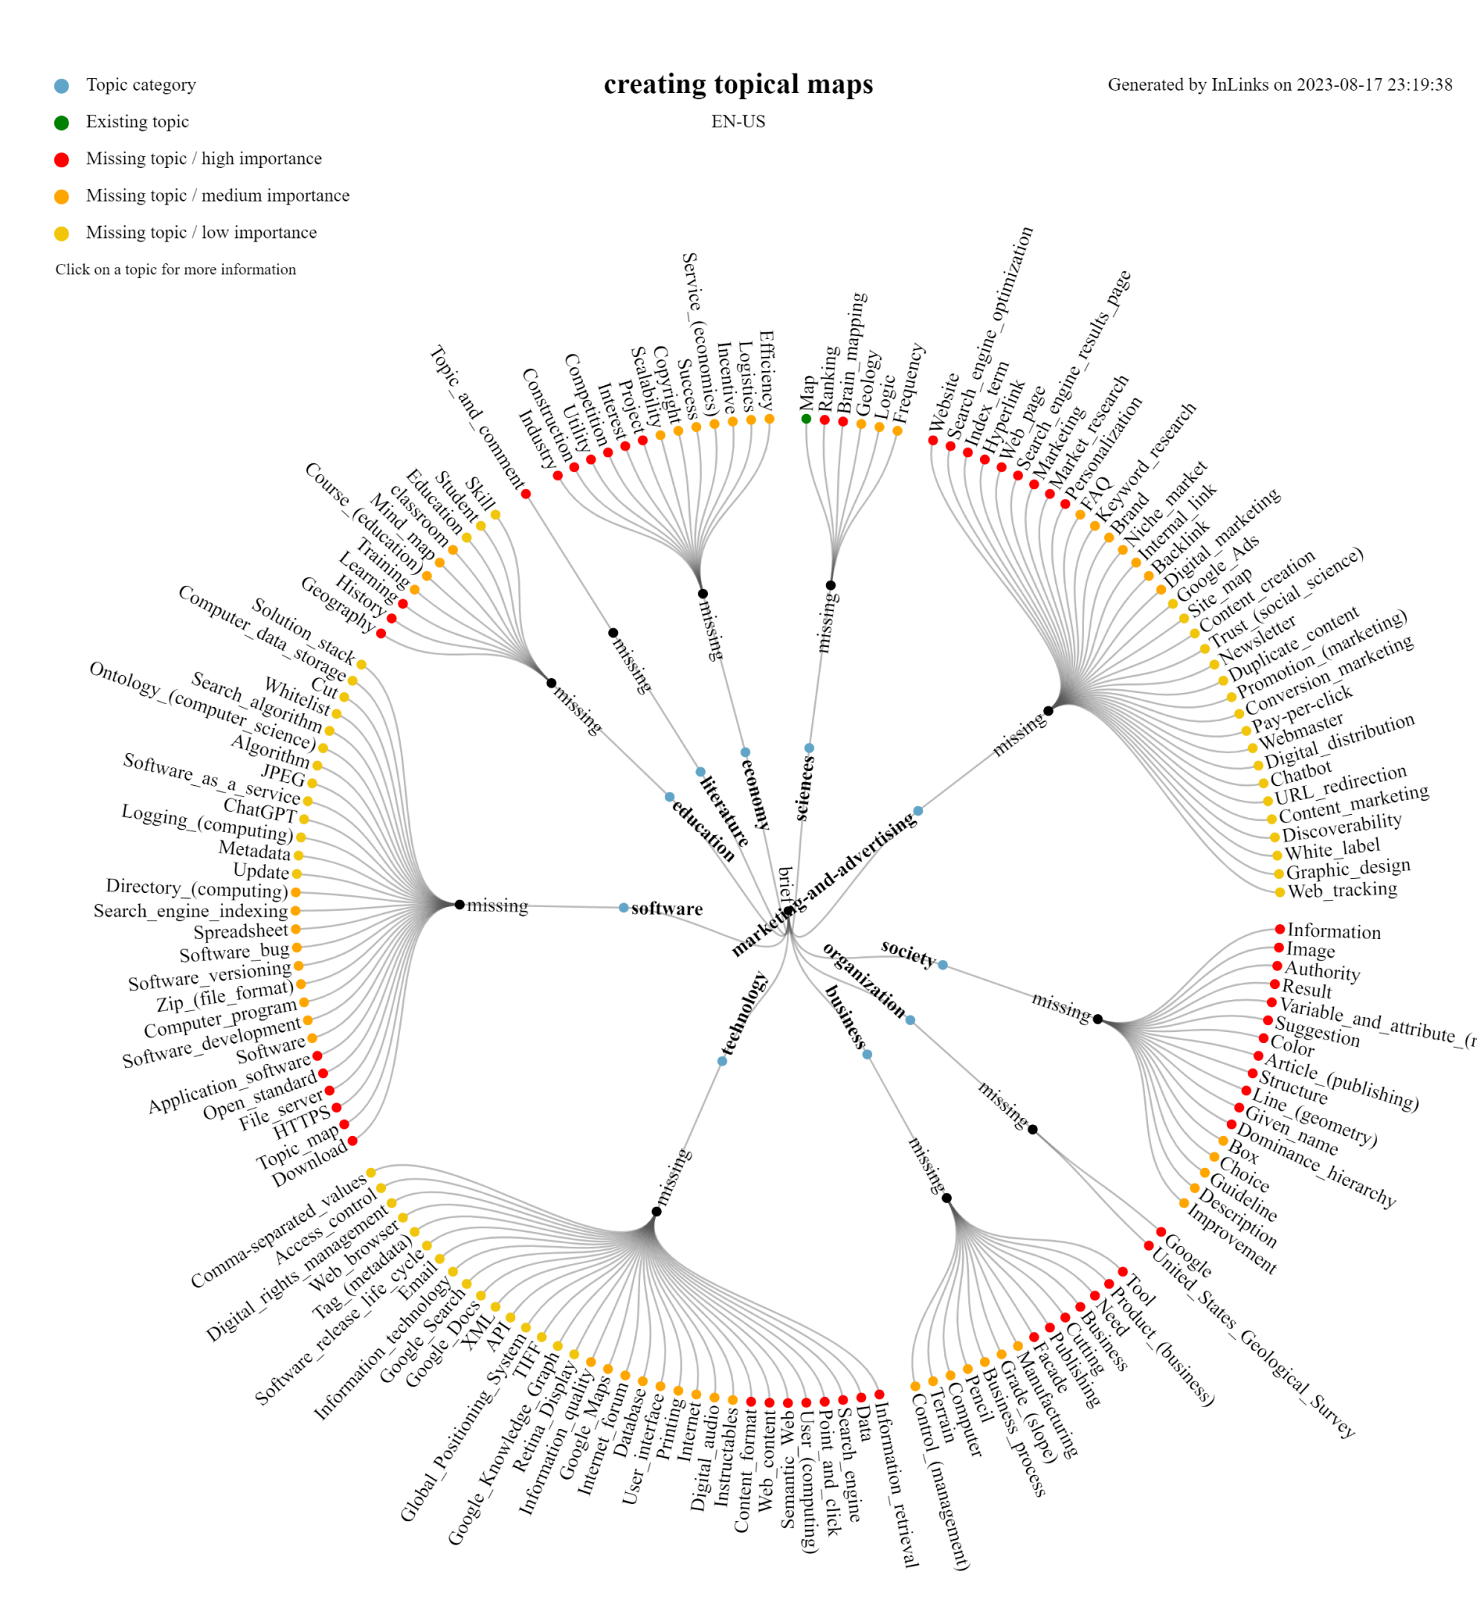
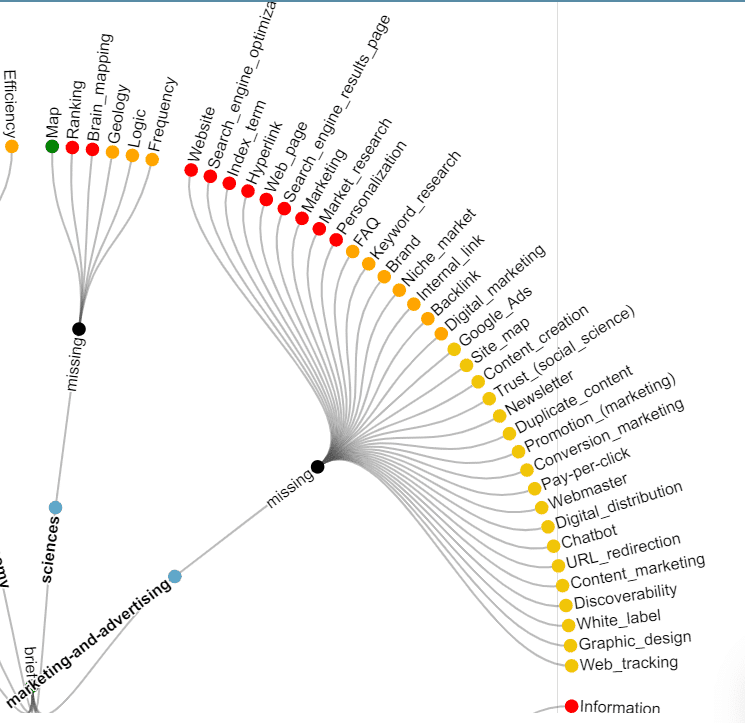
This topic map shows all the entities our NLP algorithm recognized from the top 10 results for your topic in your target market. Inlinks automatically builds a content hierarchy by clustering these entities into categories with supporting subtopics. To build authority for that topic, you’ll need to cover the categories and subtopics relevant to your business.
The tool uses the “blue” color code to represent the different categories by which search engines structure your topic. It then shows you a branch of missing subtopics and color codes them “red,” “yellow,” and “orange” to signify their relevance.
From the example below, “website,” “hyperlink,” “marketing,” and all the topics color-coded red are highly important in the marketing category. Hence, I need to create content pages around them to become an authority on “topical maps.”
Plan your content pages
The topic map provides a clear visualization of your content and can be improved by writing meaningful content around the concepts Google understands. It is, however, only one part of the InLinks content planning module. You can use the content planner to create a specific plan to prioritize keywords and build a content queue.
Generate a comprehensive content brief on InLinks to see the keywords and questions searchers are typing into Google and the exact intent they have in mind while searching. Then, you can write the content yourself or use our AI content writing assistant to save time. Either way, make sure all the content you create is semantically related to the topic you want to be known for. After writing, run your content through the optimization tool in the editor to ensure it includes all important entities associated with your topic.
Connect subtopics to pillar pages with internal links
As you write your pillar and cluster pages, use internal links to build a semantic relationship and show Google they’re topically related. The pillar pages are your content hubs. So, they should provide a quick overview of all cluster pages and link out to them. The cluster pages should also link to the pillar page and themselves where relevant.
Make sure to use optimized and varied anchor texts for your internal links. Or better still, bring your content pages into InLinks so the tool can build contextually relevant links between your pages.
To further optimize your topical map, implement structured data as you create content. The schema markups will help describe your entities and their relationship to other entities in a way Google understands.
Review and update your topic map
As you add more content pages, your topical map should change to reflect your site’s content structure and authority in your niche. So, it’s important to constantly review it to ensure you’re on the right track.
You can use InLinks’ site-wide topic map for this. Just add all your content pages to a project, then navigate to Topics from the left panel. In the Topics screen, click the blue Show button next to Display Topic Wheel at the top right to see your website’s topical map. You’ll see how many topics you’ve covered, how well you’ve covered them, and the important ones you’re missing. From here, you can adjust your content plan accordingly.
Export options for your topic map
InLinks allows you to export your topic map as a PNG or CSV file. The PNG is useful for showing your clients what a topical map looks like. Additionally, you can show them a read-only version of the entire content brief you’ve generated with InLinks by sharing the public URL. For example, here’s the public URL for the content brief used in this article.
Semantic SEO has changed the game. Use InLinks to get ahead
With the knowledge graph and algorithms like Hummingbird, RankBrain, BERT, and MUM, Google is rewarding websites that prioritize comprehensive, meaningful, and valuable content.
So, instead of creating content without a plan and expecting it to rank, use InLinks to inform your semantic SEO strategy from the get-go.
InLinks provides entity-based keyword research and content planning, internal linking automation, schema markup, and social media management to move your business forward.
Related:
The importance of topical maps for SEO (OnCrawl)
| This post was researched and drafted by Juliet John and reviewed and edited by Dixon Jones. |
This is a must-have tool.
Leave a Reply
Want to join the discussion?Feel free to contribute!